Chapter Eleven
Displays of HIPSYS Data
HIPSYS profiles can be printed out in a number of different forms. The Circles, Histogram and Assist displays have already been explained and are included in the Print Special option. (See Chapters Five and Eleven.) However, a further explanation of them will probably not go astray.
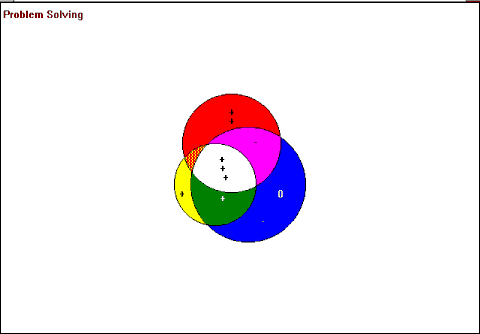
The size of a circle indicates the extent to which respondents have definite opinions, that is, "Agree" or "Disagree", and including "Polarised" responses. The smaller the circle, the more "Neither Agree nor Disagree" overall responses were given.
Pluses indicate desirable responses, minuses indicate undesirable responses. In the standard field-tested HIPSYS classes, the statements in the questionnaires are given pluses or minuses when the following criteria are in harmony: -
Pluses and Minuses and Organisational Culture
But remember, you can change the questions and make them positive or negative as you see fit. For example, the following question/statement may be given a plus in one environment but a minus in another:
"I hold my subordinates accountable only for their own work."
In some organizations, if a manager were to agree with this statement, teamwork would be the first casualty, so you may want an "Agree" response to yield a minus. If so, with this question, you would click on the "Negative Statement" box in HIP Edit, Edit Questions so that a cross appears in it. An "Agree" response would then yield a minus.
Real teamwork can mean neglecting one’s own work in order to help out in another department when one can do so legally, competently and safely and it is in the best interests of the organization as a whole that one does so.
So, maybe the Dragline Supervisor should lend the Coaling Supervisor his bulldozer when floods have washed out the haul road and he can’t get coal to the crusher. What if the dozer is suddenly needed to move a spoil heap slip near the dragline? Hey, sometimes that will happen. If it does, pat him on the back for his helpful attitude. Nine times out of ten it will be the right thing to do by the organisation. We don’t want fear of accountability for one’s own job to create a lack of co-operation within the organization.
Maybe the Workshop Supervisor should lend his fitters to the Dragline Supervisor when that one hundred million dollar machine is down and the field fitters need some help to get it going again. Then what if an emergency repair comes into the Workshop and the fitters are several kilometers down the mining lease working on the dragline? Give the Workshop Supervisor a pat on the back because nine times out of ten his co-operation will have worked out best for the mine as a whole. Learn to live with the odd occasion when it may backfire on him.
We don’t want to hear the "Not my job" syndrome. If, at a bulk handling terminal, a clerk, a storeman, or an electrician sees a big chunk of metal going up the conveyor belt to the ship loader, they should hit the button and stop the belt. A rip in a conveyor belt can be very costly. If it turns out to be a bit of cardboard blackened by coal dust and he/she thought it may have been metal, don’t ever tell them they shouldn’t have done it because it wasn’t their job. Pat them on the back.
This kind of attitude creates good inter-departmental teamwork - and that is what many organizations neglect. Their teamwork within departments may be good, but between departments it could often be a lot better. Get rid of the "work to rule" mindset by holding people accountable for taking initiatives when they were in a position to do so. Their job description will outline their prescribed activities; their discretionary activities are probably not in there but perhaps they should be held accountable for them anyway. The rule should be, "If you can do it legally, competently and safely and it is in the best interests of the organization that you do it, be prepared to explain why you didn’t."
But it depends what kind of organisational culture your client wants to create or maintain. You see, in other organizations, you may want agreement with this question/statement to yield a minus. In assembly lines (or disassembly lines in the case of abattoirs) and some processing line jobs, you may want people to stick to the letter of their job descriptions only and not take any initiatives outside it. In which case, with this question, you would NOT click on the "Negative Statement" box in HIP Edit, Edit Questions so that NO cross appears in it. An "Agree" response would then yield a plus and a "Disagree" would yield a minus.
Zeros indicate that respondents have definite opinions but they are polarised. At least 30% agree and at least 30% disagree with the same statement, and the difference between them is less than 25%, showing responses that are firm, but polarised.

Figure 11.1
Circles Display with Symbols
Most HIPSYS Users like the three intersecting circles as a method of graphically displaying a lot of complex data in a simple, highly visual and easy-to-understand form. However, the same data can be displayed as squares if preferred.
Simply click the mouse of the Display menu item and select Squares.
The HIPSYS program actually draws profiles in squares initially, and then adapts them to circles. However, where there is a very small overlap in the squares, drawing the curves to convert them to circles can cut the corners in a manner that eliminates a very small overlap. In such cases you may see symbols (i.e., pluses, minuses and zeros) shown outside the circles with a line pointing to where they would be located if the circles had overlapped. You may prefer to display such profiles as Squares.
Squares are a more accurate representation of the actual profiles but most find Circles more aesthetically appealing. The Squares option allows you to choose for yourself.
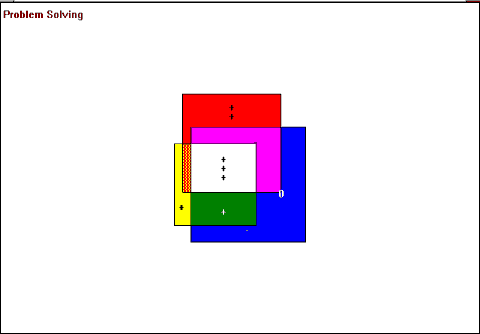
Figure 11.2
Squares Display with Symbols
When dealing with Circles and Squares, responses to image perspectives are compared and aggregated into positive, negative, polarised and neither categories. For example, if we assume all statements in a questionnaire are positive, then: -
If SI = 'A', PRO = 'A' and PER = 'D', then SI.PRO = '+' and PER = '-'.
If SI = 'D', PRO = 'P' and PER = 'D', then SI.PER = '-' and PRO = '0'.
If SI = 'A', PRO = 'P' and PER = 'D', then SI = '+', PRO = '0' and PER = '-'.
If SI = 'A', PRO = 'P' and PER = 'N', then SI = '+' and PRO = '0' and PER shrinks.
Note: PRO = 'P' would only occur in an application where there is more than one respondent to the Projected Image questionnaire.
Note: 'N' means response is "Neither Agree nor Disagree" (i.e., "Don't Know" or "Not Applicable") and 'P' means responses were definite but polarised.
Note: 'N' responses shrink the size of the Circles and Squares.
(See also HIPSYS Methodology Manual.)
Also under the "Display" button are the following: -
The displays in histogram form show the percentage of Agrees, Disagrees, Neither Agree nor Disagrees, and Polarised responses for each facet and each image perspective.
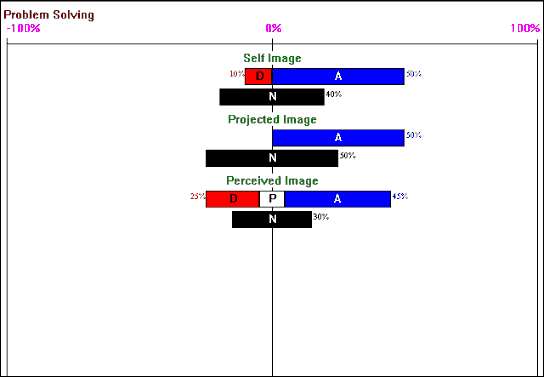
Figure 11.3
Histogram Display
Note: Polarised responses count as half Agree and half Disagree. In the above example the 10% polarised response to the Perceived Image is shown (and counted) as 5% on each side.
The Assist mode displays all the Self Image questions for each facet, the Self Image, Projected Image and Perceived Image responses (or whatever the three image perspectives may be called) and the percentages of Agree, Disagree and Neither Agree nor Disagree.
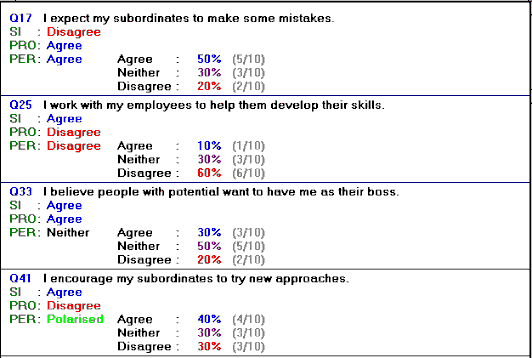
Figure 11.4
Assist Display
Where appropriate, the percentage responses of component groups are also given where image perspectives have been broken down, as shown in the Self Image in Figure 11.5 below where the component groups for the SELF IMAGE Parent image perspective (SI) are Managers (Man), Supervisors (Sup) and Operators (Oper). In this case the responses have been weighted so that each component group has an equal impact on the aggregate image perspective. Weightings, however, are optional. (See page 39 in Chapter Three.)
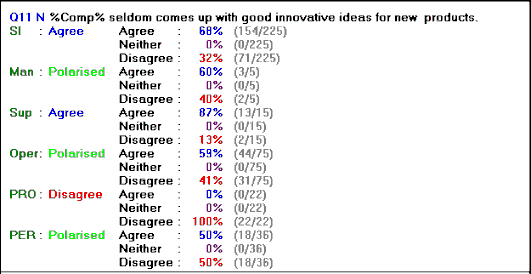
Figure 11.5
Assist Display
with SI Component Groups Weighted by 15, 5 and 1 Respectively
(Man 5x15=75, Sup 15x5=75 and Oper 75x1=75. Total: 75+75+75=225)
(See also HIPSYS Methodology Manual.)
Note: Where there is a large number of component groups of image perspectives, say, six or more, you may need to reduce the size of the font so that all the image perspectives and their breakdowns into component groups are shown on the screen with their relevant questions. To do this, click on Windows, then on Default if you wish to change the font size on all displays, or on Select Font if you wish to change the font size only on the display you have highlighted. Then click on the Font, the Font Style and the Size you want and OK.
This is a table showing the extent of response type for each Image Perspective response. For example: -
· If SI = 'A', PRO = "A" and PER = 'N', then
SI = 'A',
PRO = 'A'
PER = "N"
SI.PRO = 'A'
SI.PER = 'HA'
PRO.PER = 'HA
SI.PRO.PER = 'HA'.
· If SI = 'A', PRO = "N" and PER = 'D', then
SI = 'A'
PRO = 'N'
PER = 'D'
SI.PRO = 'HA'
SI.PER = 'P'
PRO.PER = 'HD'
SI.PRO.PER = 'P'.
The final score for each response type is worked out using the following calculation:-
· Add 0 for each result of "Neither Agree nor Disagree".
· Add 3 for each result of "Agree" (or "Disagree" where the statement is negative).
· Add 1 for each result of "Half Agree" (or "Half Disagree" where the statement is negative).
· Add -2 for each result of "Polarised".
· Add -1 for each result of "Half Disagree" (or "Half Agree" where the statement is negative).
· Add -3 for each result of "Disagree"(or "Agree" where the statement is negative).
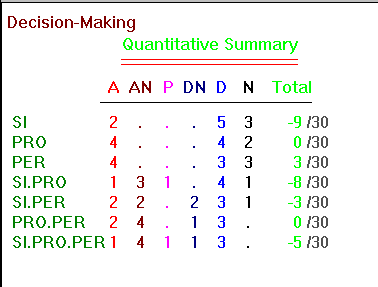
Figure 11.6
Text Report on a Facet with Ten Question
(Maximum Positive Score is 10 x 3 = 30 and Maximum Negative Score is 10 x -3 = -30)
A Congruence Report is a table showing the number of "Agrees" (includes "Disagrees" where the statements are negative), "Disagrees" (includes "Agrees" where the statements are negative) and "Polarised" responses in each HIP component. This format is seldom used as the information is better displayed in the Circles with symbols.
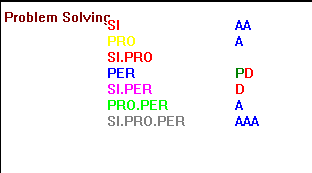
Figure 11.7
Congruence Report
VIEWING COMPONENT GROUPS OF IMAGE PERSPECTIVES
If you have broken down image perspectives into component groups (see Adapting an Existing HIPSYS Class in Chapter Three), then as well as viewing the data as above you have other very useful options.
Open the sunsugar example in HIPSYS. The Summary Circle will display automatically. Now click on Facet and Lead. In this example, the Self Image of an organization has been broken down into the Self Image Management has of it, the Self Image Supervision has of it and the Self Image Workforce has of it, you can now display the data as follows: -
Strike Window and New.
Then do that again and again so that you have four Circles Displays in cascade form.
Then strike Window and Tile. You will now see four identical windows of a Circle Display of the Leadership facet on the screen.
Now click on the top right hand window, then on Options and Select Perspectives. You will see the dialogue box in Figure 11.8 below.
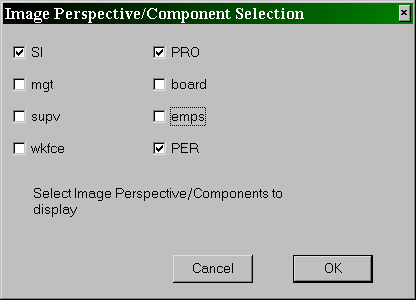
Figure 11.8
Dialogue Box Showing Selection of Three Parent Image Perspectives (in upper case)
for Display
Click off the cross in the SI box and click on mgt and OK. In the top right hand window, the red circle will now show the Self Image of the Managers only.
Now repeat that procedure for your bottom left hand window, only this time in the dialogue box click off the cross in SI and click on supv. In the bottom left hand window the red circle will now display the Self Image of the Supervisors.
Finally, click on the bottom right hand window and repeat the procedure this time clicking off SI and clicking on wkfce. In that window the red circle will now display the Self Image of the Workforce in the Select Perspectives box.
So you know which is which, click on Options and All Legends On and the legends will appear in each window to remind you what the Circle Displays represent. If you now click on Options and All PlusMinus On, your display will now look like Figure 11.9 below. The windows show how each of those three component groups of Self Image compares with the Projected Image and the Perceived Image. You can often make some pretty revealing and useful comparisons this way. For example, the Workforce’s noncommittal responses to questions on leadership are revealed by the small size of the red circle in the bottom right window.
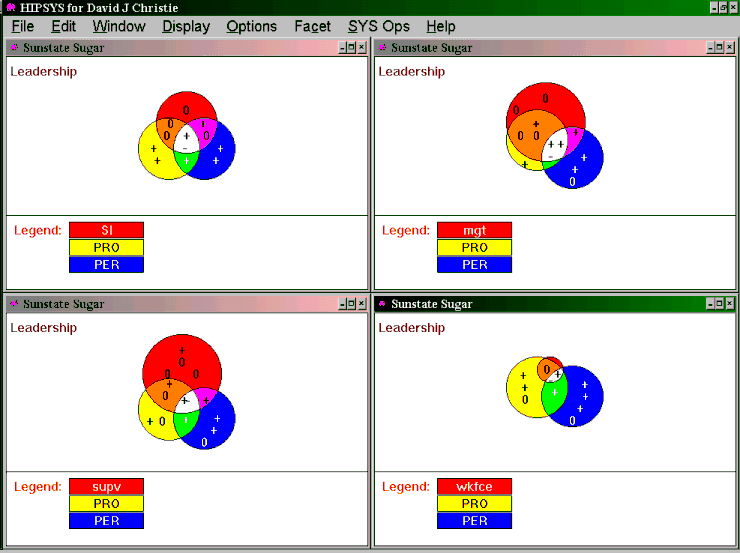
Figure 11.9
Circles Displays of Aggregate Self Image and Its Component Groups (Red Circles) Compared with Projected Image and Perceived Image on Leadership Facet
You can navigate back and forth between the facets whilst maintaining these displays by striking "Shift +" to advance through the facets or "-" to go back through them.
You may also strike Facet and select a facet to be displayed in any window that you have highlighted by clicking on it first.
You can also examine the three components of Self Image in one integrated display. Close down the three windows on the top right, bottom left and bottom right. Click on the remaining (top left) window and go to full screen. Then click on Options and Select Perspectives. This time click off the crosses in SI and PRO and PER and click on mgt and supv and wkfce. The dialogue box will look like Figure 11.10 below.

Figure 11.10
Window Showing Selection of Three Component Groups for Display
Click on OK and your display will now look like Figure 11.11 below.
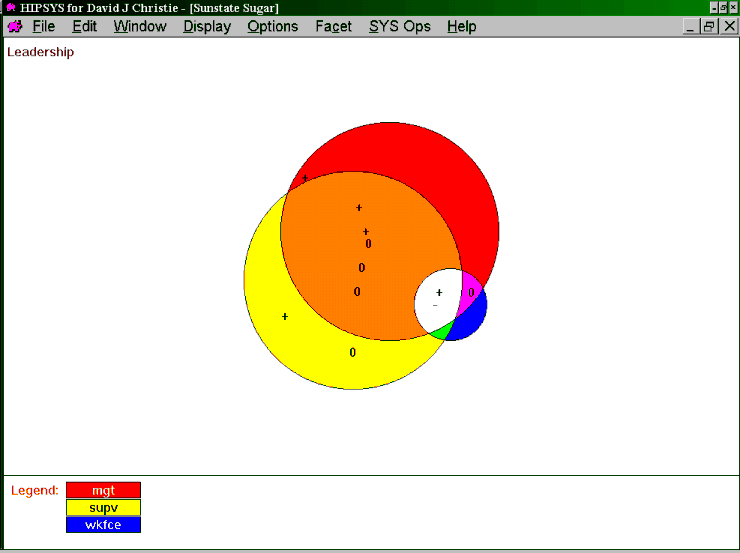
Figure 11.11
Circles Display of Leadership Facet Comparing Components of Self Image
i.e. management, supervision and workforce.
You can now see at a glance the degrees of congruence between those three levels in the organization regarding their perceptions of the facet Leadership.
See below for instructions on how to print out such data.
(Further examples are given in the HIPSYS Methodology Manual.)
There are three methods of printing a HIPSYS profile. All printing is done to the default printer.
1 By Selected Window
This method allows you to select with the mouse, which windows will print.
Note: Each window has a print attribute that may be "On" or "Off" and can be viewed by selecting the window and then selecting Options. This sub-menu will indicate the current print status of the window. A window has the print attribute "On" if there is a check mark next to "Will Print".
When all required windows have been selected, you may print them all by selecting the Print Windows option of the File menu in HIPSYS. Then all selected windows (i.e., those with the print attribute "On") will print the current contents using the same method as seen on the screen. Each print is fitted on the current page if possible and printed on the next page if necessary.
Note: Some display methods display somewhat differently on the printer than on the screen.
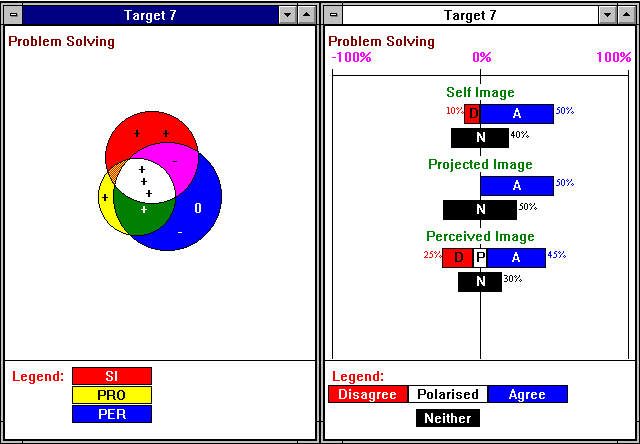
Figure 11.12
Select Window Print Option
2. Through Selected Windows
This method is similar to printing selected windows. The main difference is that the windows selected for "Print Through" will print every facet and the summary in the current display format.
After selecting the windows to print through, select the Print Through option from the File menu in HIPSYS. The entire print for each window is performed to completion before the next one is started.
3. By Special Arrangement
This method, which most people find to be the most useful, will prompt you for the profiles you wish to print and then for the facets you wish to print. Each selected facet for each selected profile or survey will then be printed in the special format of one Circle Display with plus, minus and zero symbols, one Histogram Display and one Assist Display.
The layout places the Circle Display in the top left, the Histogram Display in the top right and the Assist Display filling the rest of the page (see Figure 11.13) and spanning other pages as needed.
To get this, click on File and Print Special, then select the facets you want (it will default to "All On"), and "OK".
Note: When there is only one survey loaded you will not be prompted for the survey selection.
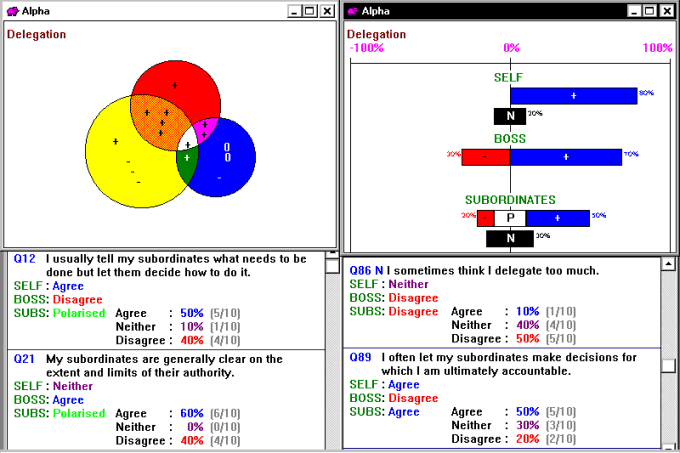
Figure 11.13
Print Special Print Option
Printing Out Components Group Displays of Image Perspectives
Components of image perspectives, such as those show in Figures 11.9 and 11.11, can be printed out through Word for Windows or some similar word processing software package.
When you are in HIPSYS and have on the screen the display you want to print out (such as that shown in Figure 11.11), strike Alt and Print Screen together.
Then strike Alt and Tab together to get to Program Manager.
Then open Word for Windows and open a new document.
Then strike Edit then Paste Special.
In the next dialogue box that appears, strike Paste Special or Device Independent Bitmap and the screen display you had in HIPSYS will be reproduced in your document.
You may then add any text you wish such as headings or notes to explain the HIPSYS profiles.
Then go to File and Print.
(See HIPSYS Methodology Manual for further examples.)
Printing Out Other Combinations of HIPSYS Data
Other combinations of HIPSYS data can be printed out by following the procedure just described.