Chapter Five
Giving Feedback and Facilitating Discussion on HIPSYS Data
There are a number of ways you can explore and discuss a HIPSYS profile with a client. Here is a recommended methodology. When you've gained a bit of experience and become more familiar with HIPSYS, you may decide to develop different approaches.
One-to-One Feedback and Discussion
Feedback is usually best given on a one-to-one basis in the first instance. Even for organizational applications of HIPSYS the senior person (or team) should see the results in private first so they are not hit with any bombshells in public.
The first step is to ensure that the client fully understands the HIPSYS model. The extent and depth of the explanation necessary will depend on how familiar the client is with HIPSYS. It should take only a few minutes to outline the model as explained in Chapter One. Making up a simple PowerPoint slide show that illustrates the structure of the particular HIPSYS class is a good way to do that.
When you've done that, the client should sit alongside the facilitator with each of them facing a computer or display screen, or the facilitator facing a laptop and the client a monitor.
Let's try an example that you may have already downloaded from the web page at:
Go to Windows and double click on the HIPSYS icon.
Now go to full screen, and then click on File and Open.
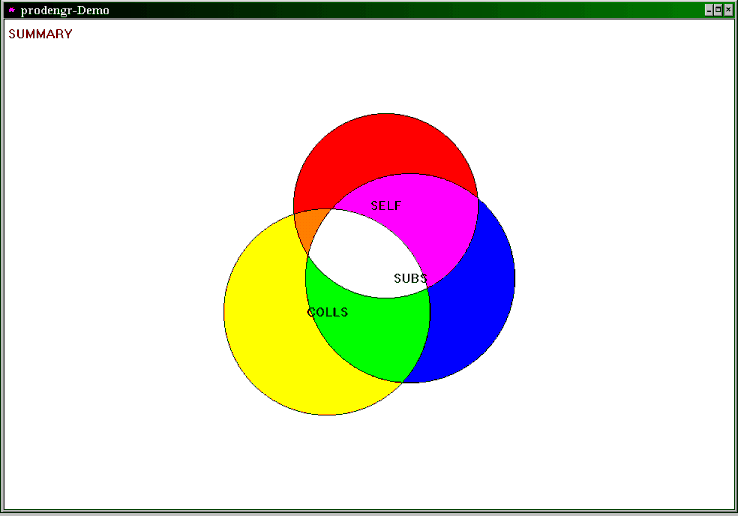
Double click on the relevant file - for our example, let's make it prodengr.svy, (or directory and then the particular client's survey file name) and click the OK button. Go to full screen then Window and Tile. You should now see the following display:
Figure 5.1
Summary Circles Display of prodengr-demo
Click on Options and All Legends On so that the client can be reminded that, in this case, the SELF circle is Red, the COLLEAGUES circle is Yellow and the SUBORDINATES circle is Blue.
Point out and discuss the significance of the overlaps and the sizes of the circles.
Click on Window, then New.
When the new window comes up, click on Window again then Tile.
Now click on the right-hand window, then on Display and Histogram. Discuss the distribution of responses shown by the Histogram.
Then click on the left-hand window, then on Options and All Plus/Minus On. Pluses, minuses and zeros will then appear on the Circles. Discuss the significance of these. Make comparisons between the Circles and the Histogram to show that they are just different ways of gaining information from the same data.
The display you are now looking at should be something like the example shown in Figure 5.2 below.
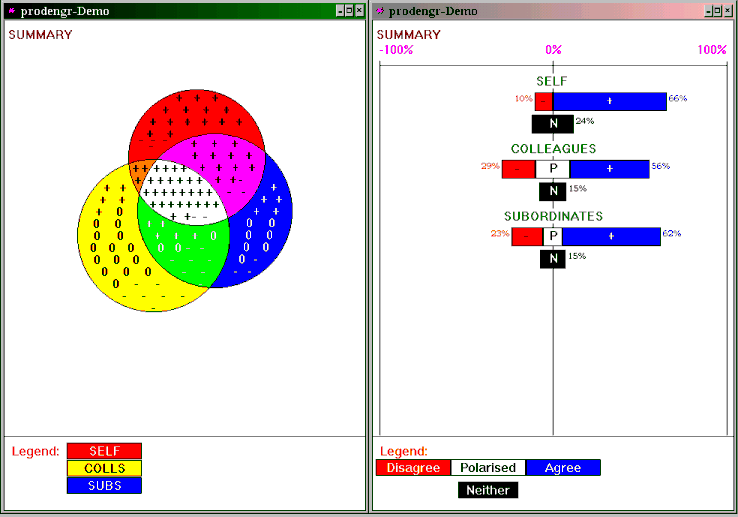
Figure 5.2
Summary Circles with Symbols and Histogram Displays of prodengr
To move on to the first facet, hit Shift and the "+" sign on the keyboard. The circles will appear with pluses, minuses and zeros in the left-hand window and the histogram on the right for the facet called "Delegation". Discuss these as you did for the Circles and Histogram Summaries.
When you are ready to look at the specific questions for this particular facet, click on the right-hand window with the Histogram in it then on Display and Assist. The SELF statements for the Delegation facet will then be displayed together with the SELF, COLLEAGUES and SUBORDINATES' responses to them (or whatever the image perspectives are for the particular HIPSYS Class you may be viewing). The responses are shown in both percentage and numerical forms, as shown in the right-hand side of Figure 5.3.
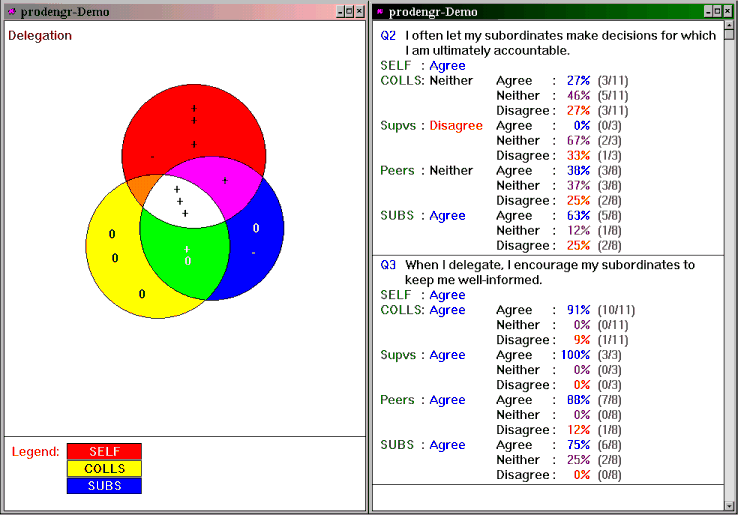
Figure 5.3
Circles and Assist Displays of Delegation Facet
You may now facilitate a discussion, question by question, on what may have given rise to the responses on that particular facet, reinforcing apparent strengths and areas for possible improvement.
The facilitator may read out each statement using the mouse arrow to direct the client's attention to it and explain how positive, non-committal, negative and polarised responses are displayed by a "+", a shrinking of the Circles, a "-", or a "0" respectively. The location of symbols on the Circles can also be pointed out if desired. (See later in this chapter and also Chapter Eleven.)
Sometimes it is appropriate to discuss minority responses. (See Chapter Twelve.)
You can scroll down the questions by clicking on the downward-pointing arrow at the bottom right-hand corner of your screen.
You can also scroll back up the questions by clicking on the upward-pointing arrow near the top right-hand corner. Alternatively, if you have a wheel on your mouse, use that.
When you have discussed all the questions and responses of that facet, click on the right-hand window (the one with the questions in it), then on Display and then Histogram. The Histogram can now be seen alongside the Circles to facilitate a final comment or two on that particular facet. And the screen is also now set up for movement to the next facet.
To move on to the next facet strike "Shift +". If you are displaying the prodengr-Demo profile, the facet you are now looking at will be Counselling. Once again the Circles with pluses, minuses and zeros will appear alongside the Histogram. The client may now be asked to give his/her interpretation of what he/she sees. The facilitator may clarify, correct and expand as appropriate.
Then click on the right-hand window (the Histogram), then on Display, then on Assist. You can now discuss the questions and responses and their relationship to the Circles again.
When you have gone through all the facets, the Summary will come up again. You may discuss the Facet Summary (which appears as the Assist display) if you wish and explain its scoring scale. (See in Chapter Eleven.) But most people aren't really interested in that so don't push it. Alternatively, or as well, you may wish to have a look at the Histogram Summary alongside the Circles Summary by clicking on the right-hand window, then on Display and then on Histogram.
As you discuss each facet, you may give the client a coloured printout of the Circles with pluses, minuses and zeros on the top left, the Histogram on the top right and the Assist below. All this can usually be printed on one A4 page using the Print Special command and an appropriate font size. (See By Special Arrangement in Chapter Eleven.) Alternatively, you may prefer to give them the entire printout at the end of your session.
Finally, when you have discussed all facets and the Summary, you can display all facets on the screen simultaneously.
First, click on the cross sign at the top right-hand corner of the right-hand window which is currently displaying the Histogram Summary r . That window will disappear. Now click on Options and All Legends Off, because legends clutter up the images on a Multi Facet display.
Now click on Window then on Multi Facet. All facets plus the Summary will now be visible on the screen at once as shown in Figure 5.4.
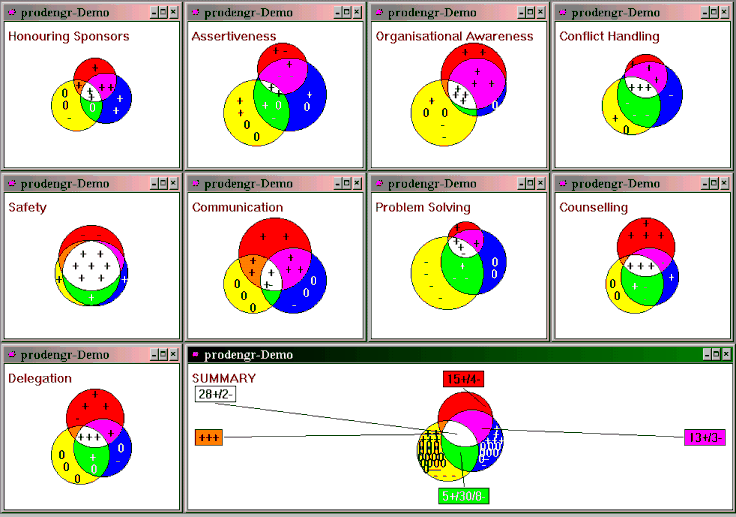
Figure 5.4
Multi Facet Display of prodengr-Demo
You may then ask the client to examine these facet profiles and identify from them what his/her particular strengths seem to be. You may then ask him/her to look at the profiles again and discuss areas for development.
These one-to-one feedback sessions take an average of one-and-a-half to two hours each for a ten-facet class of a hundred questions; although a few, including some Plant Managers, Mine Managers and Chief Executive Officers with some major issues to explore, have taken longer.
If there is to be a plenary session in which several client individuals will come together to examine and discuss their profiles, you should remind them to bring their colour-printed profiles with them for reference.
Sometimes it is useful to compare the Self Image, the Projected Image and the Perceived Image of an individual or an organization. (See Chapter Seven.) The Self Image can be defined as what one thinks, believes or assumes; the Projected Image as what one does or has done; and the Perceived Image as the perceptions others have of that person or organization. So, in this case, the client (or target) would complete two separate questionnaires, preferably a day or two apart, and the third questionnaire can be completed by his/her subordinates (or customers, or whomever).
An example of a question/statement that would be appropriate for those three image perspectives is:
Self Image "My subordinates are clear on the extent and limits of their authority."
Projected Image "Within the past twelve months I have clarified with each of my subordinates the extent and limits of their authority."
Perceived Image "I am clear on the extent and limits of my authority."
(of Subordinates)
(For more on how to word questionnaires, see Chapter Eight.)
If the same HIPSYS class is used, profiles can be compared a year or so later to measure progress, as shown in Figure 5.5.
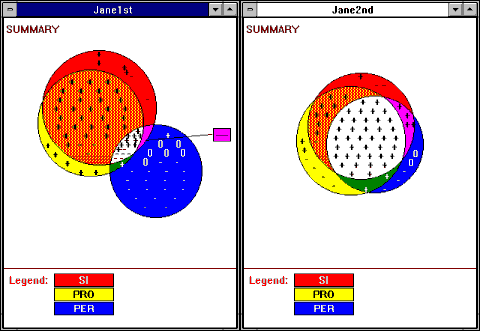
Figure 5.5
A Comparison of a Client's first HIPSYS Summary (Jane1st) with a subsequent one (Jane2nd)
Group Discussion of HIPSYS Profiles
Discussing profiles in groups with helpful and constructive intent can be a very good team building exercise. If you propose to do this, you should let people know in advance, before questionnaires are completed, so that it does not necessarily have to conflict with any assurances of confidentiality or anonymity which may have been given when questionnaires were completed. Confidentiality of response can still be maintained in that individuals don't have to say what their responses about someone were, but rather help the person to understand why a majority may have a given perception of them.
It is usually best to announce this intention as questionnaires are being administered, so groups have no opportunity to collude to give each other flattering rather than honest profiles. (See Chapter Ten: How to Administer Questionnaires.)
Although HIPSYS will allow up to twenty profiles to be displayed on the screen simultaneously, the displays are usually too small and sometimes the bottom part gets chopped off. Twelve is usually the maximum number that can be looked at without too much trouble. You will need to have a data projector linked up to your computer.
Go over the HIPSYS model again as a refresher (see Chapter One). Use a PowerPoint slide show to explain the structure of the particular HIPSYS class you are using, the significance of the overlaps and Circles' size, and the pluses, minuses and zeros. Then, when you have got into the appropriate file or directory, click and/or scroll on all the relevant clients/targets and OK. For example, click on the directory mgt-12demo, and then select Managers A to F.
The clients you have selected will appear in cascade form then Tile automatically. The Summary profiles of all six subjects will appear on the screen at once. (You may have to go to full screen and Windows and Tile so the images will fill your screen.) Summaries with symbols can look a bit cluttered on a multi-client display but you can discuss the displays without symbols briefly if you wish then move on to the first facet and click on Options and All Pluses Minuses On as you did in the one-to-one sessions. Your display will now look like Figure 5.6.
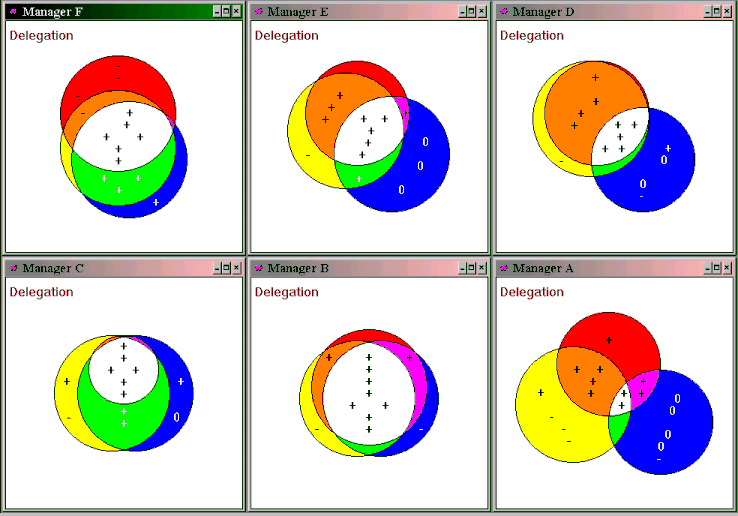
Figure 5.6
Multi-Client Display of Delegation Facet
By this stage, most people know what the circles mean, so you may not need to display the legends. However, if you think you should, go to Options and click on All Legends On.
Individuals should now be encouraged to explore and discuss their profiles with those present, or examine and discuss constructively the profiles of others.
Individuals may initially choose to remain anonymous and simply discuss profiles by number or by letter or some other designation such as a code name they used in HIP Input. In the writer's experience, however, all individuals have eventually declared their profiles openly, albeit sometimes in response to significant group pressure. Also, if all bar one participant expose their profiles, the anonymity of that one has then been shot to bits.
If anyone wishes to examine a particular profile in detail, simply click on the full screen symbol of the appropriate window (1 ). This will enlarge it to full screen.
You may then call up a Histogram or Assist as you did in the one-to-one sessions and examine the percentage responses to particular questions. Individual respondents (if they are present in the group) may then say how they may have interpreted particular questions and give reasons for their responses.
To return to the six profiles again, simply click on the double box symbol in the top right-hand corner (2 ) and that will restore the multi-client display.
Those receiving feedback from the group should be encouraged to take notes on where they may need to improve to help them to draft Personal Development Plans or Action Points later.
A group of ten to twelve participants usually takes an average of about forty-five minutes to discuss each facet. Maybe more for the first one or two and less for the last couple as many issues coming up then may already have been discussed.
When all facets have been explored and discussed, the Summaries will appear next. These may be revisited one at a time as a means of giving an overview of the session.
The facilitator/consultant, who would have been taking notes throughout the session (right?), could go round the room asking each individual to share what he/she got out of the session and fill in any aspects that may have been missed. The individual should then be invited to outline his/her Personal Development Plan or Action Points for the next few months as a means of improving his/her personal effectiveness as well as the effectiveness of his/her contributions to the total team.
It may also be appropriate for team members to give public declarations of what support they will give one another in coaching, mentoring or implementing any behavioural changes.
For an eight to ten-person management team doing a ten-facet HIPSYS, you should allow at least two days for the one-to-one sessions and one-and-a-half to two days for the plenary session. That is three-and-a-half to four days of consulting time. It will invariably lead to downstream consulting activities later on. (See Chapter Thirteen.)
Feedback and Discussion of Organizational Applications of HIPSYS
A similar approach can be used to feedback and discuss organizational applications of HIPSYS. Let's take the example used in Chapter One - BMPI. The results were discussed first of all with the senior management team, then with the supervisors, then with all employees in peer groups ranging in size from five to twenty-five, by department. Whilst responses to all questions are displayed, this approach enables each department to focus discussion on those issues and responses that are of particular concern to it. It also facilitates more open discussion when people have neither their boss nor their subordinates present.
In displaying the responses to all questions using the Assist display, the facilitator may take the approach that, "This is what you have said. Why have you said that?" Write down the reasons they give you and, wherever possible, ask for specific examples to support their perceptions.
Then ask, "What do you think should be done about it?" and write down their recommendations. When you check out the various reasons and recommendations with various groups and individuals, you will be able to separate the wheat from the chaff and come up with findings and recommendations that your client will find useful and helpful. Not bad for a consultant who has probably never worked in that industry in his/her life! But that's consulting - "Give me your watch and I'll tell you the time."
If you refer back to the displays of BMPI in Chapter One, you will see how the "Before and After" profiles can be compared.
Given the breakdowns into component groups of this particular class, the Select Perspectives option was particularly useful in this case. For example, when Managers and Superintendents were separated out from the MANAGER parent image perspective, it highlighted the fact that the Superintendents were much more aligned with the SUPERVISION in their perceptions under the Management facet.
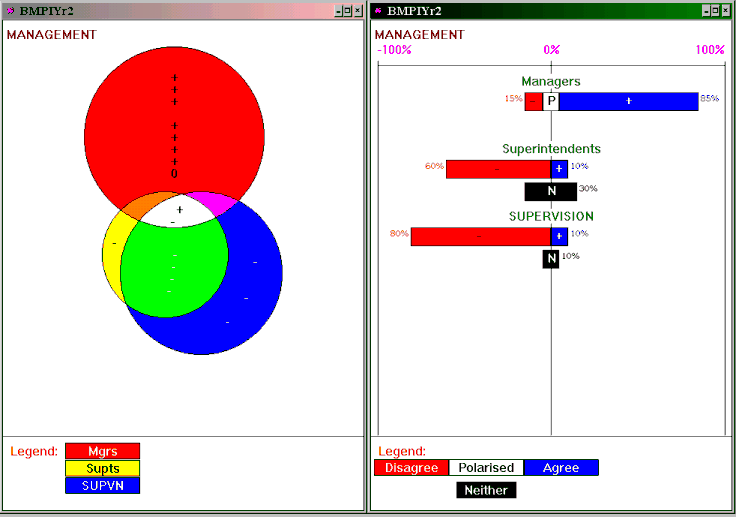
Figure 5.7
Circles and Histogram Displays of "Management" Facet of Organization bmpi in Year 1
Superintendents, whom Managers asserted were very much part of the management team, clearly didn't feel that they were. On the contrary, this HIPSYS survey indicated how alienated Superintendents felt from that team.
The Select Perspectives option also enabled interesting comparisons to be made between Production and Maintenance and Other Workforce when they were separated out from the WORKFORCE parent image perspective. In Figure 5.8 six facets have been selected to show such a comparison.
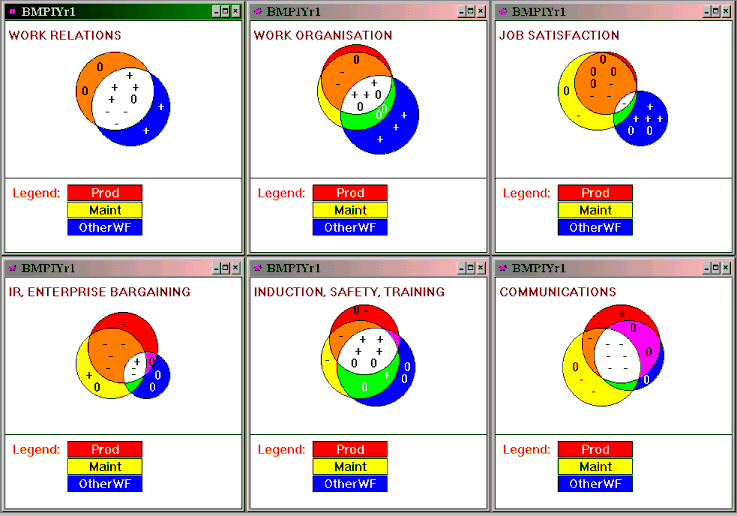
Figure 5.8
Selection of Six Facets Comparing Responses of Production, Maintenance and Other Workforce in bmpiYr1
Figure 5.8 shows that the responses of Other Workforce are more positive and less negative than those of Production and Maintenance. Whilst the responses of Production and Maintenance are mostly similar, Maintenance is the more negative on the Communications and Job Satisfaction facets.
The small size of the Blue Circle (Other Workforce) in the IR, Enterprise Bargaining facet is due to the fact that Other Workforce (computer specialists, accountants, laboratory technicians and office workers) had little interest in industrial relations issues or union activities and responded noncommittally (i.e., Neither Agree nor Disagree) to 40% of the ten questions under this facet, thereby reducing the size of that circle by 40% of its radius.
Further explanation and analysis of the data from this HIPSYS consulting assignment together with findings and recommendations are given as Case #11 in Chapter 18 of the HIPSYS Methodology Manual.
"Before and After" profiles of organizational applications called hip-ip and hip-ip2 were compared by a Professional Association. (See Case #7 in Chapter 13 of HIPSYS Methodology Manual.) Its first hip-ip was conducted in December and it's second, amended and renamed hip-ip2, in July of the following year. The full HIPSYS profiles appear as Profasn1.svy and Profasn2.svy in HIPSYS.
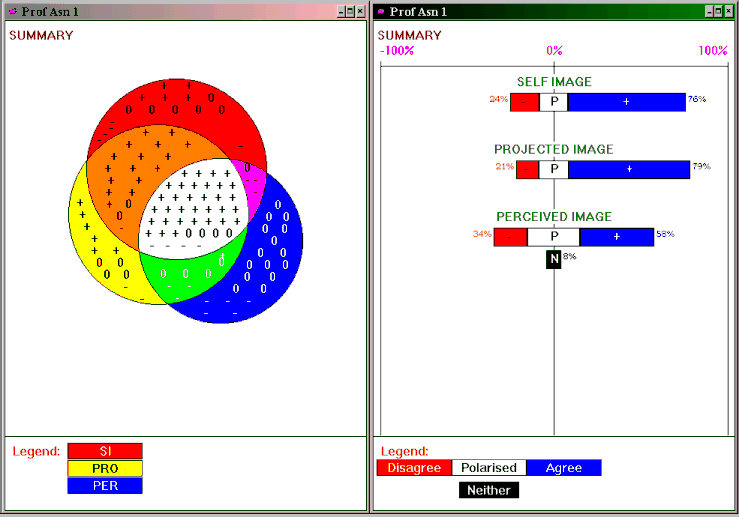
Figure 5.9
Consolidated Summary of
Professional Association's hip-ip, December, Year 1
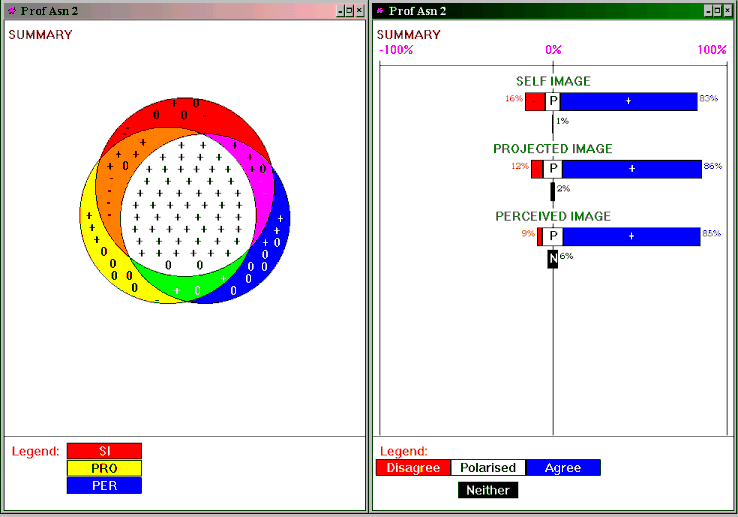
Figure 5.10
Consolidated Summary of
Professional Association's hip-ip2, July, Year 2
The two HIPSYS classes and associated methodology enabled this Professional Association to develop and implement an appropriate action plan for improvement. This resulted in its Perceived Image going from 58% positive to 85% positive within seven months. More information on this HIPSYS consulting assignment is given as Case #7 in Chapter 13 of the HIPSYS Methodology Manual.
However, not everyone improves after having undergone a HIPSYS. There can be intervening variables that weigh against improvement. For example, a production organization was experiencing severe competition on world markets, an adverse exchange rate, increasing costs and a shortage of the raw materials it needed for its production. In order to cut its costs and regain a competitive edge, it embraced new technologies and had several rounds of retrenchments. All this motivated some to give of their best to the organization so that it would ride out the crisis and survive. Others felt that the industry would not survive in the long term. Good people were leaving and others who would like to have left had nowhere to go. Some got depressed and this affected their performance in spite of their being shown how to improve.
74 people participated in the process in Year 1 and 77 participated in Year 2. Of those 77, 13 had not participated in Year 1.
The numbers in Table 5.1 below show what changed in the results of the 64 people who participated in both Year 1's and Year 2's process.
Some received input from Subordinates and others from Customers. Everyone's input also included a Self-assessment, a collective assessment from their Peers and one from their immediate Boss, except for the CEO who had input from the Board instead of a boss. This result is included in the table below under "Boss". Of course, he had no input from Peers.
One individual who had Peers and Customers in Year 2 had Peers but no Customers in Year 1, so no comparison of Customers' responses could be made is his case.
Table 5.1
Comparison of HIPSYS Results Year 1 and Year 2
|
Perceptions of: |
More Positive and/or Less Negative |
More Negative and/or Less Positive |
No Change |
|
Self (n=64)
|
51 (80%) |
12 (19%) |
1 (2%) |
|
Boss (n = 64)
|
56 (88%) |
5 (8%) |
3 (5%) |
|
Peers (n = 63)
|
47 (75%) |
9 (14%) |
7 (11%) |
|
Subordinates or Customers (n = 63)
|
49 (78%) |
6 (10%) |
8 (13%) |
The above shows that, whilst there were a few who regressed from the perspectives of some, including themselves, the great majority improved in the twelve month period between the first HIPSYS and the second. Measuring and monitoring through this process helped to keep individuals on track with the organisation's Code of Values that was considered to be important to its long-term survival.
Similarly, with organisations operating in open systems, there can be variables that have a negative effect on people's perceptions of the organization that are not always within the organisation's control. For example, government regulation, industrial problems with suppliers, natural disasters, unforseen breakdowns and sabotage can contribute to a negative HIPSYS in spite of any improvements that may have been made.